
WT1 (Line Graph)
The graph below shows the number of university graduates in Canada from 1992 to 2007
Summarise the information by selecting and reporting the main features and make comparisons where relevant.
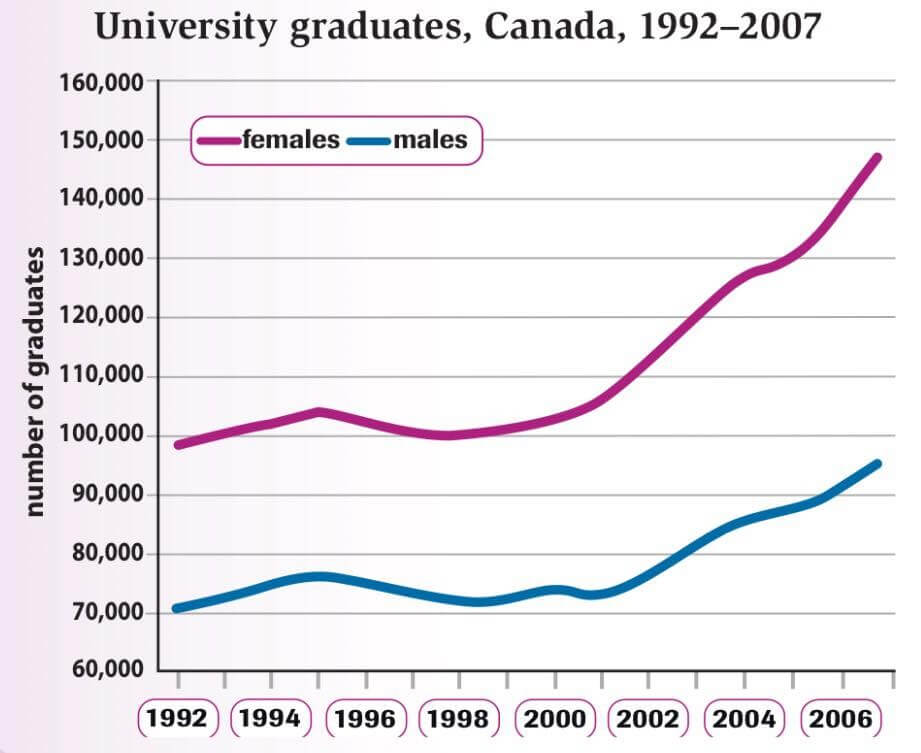
The given line graph indicates the number of female and male graduates between 1992 and 2007.
Overall, there was an increase in the proportion of graduates of Canadian universities. The figure for females was much greater over the recorded time than men’s number. Interestingly, the rising trend of curves was almost the same for both representatives.
In 1992, the number of female students who graduated university started at just below 100,000 and afterwards it began to increase until 1995. Despite a slight drop between latter time and 1998, the quantity of graduates grew considerably by 50% until 2007.
The beginning point of the sum of males who finished the university studies was around seventy thousand. The figure shows a growth by approximately 7,000 graduates until 1995 and a decline by the same number until the middle of 1998. Although there was a small variation, the figure continued to go up reaching its highest point at about 95,000 graduates in 2007.
There were a greater number of female graduates in Canada in comparison with males. Nevertheless, these figures climbed gradually at the similar rate and by showing almost the same trend from 1992 to 2007.
by Gulmira Kinzhekeyeva
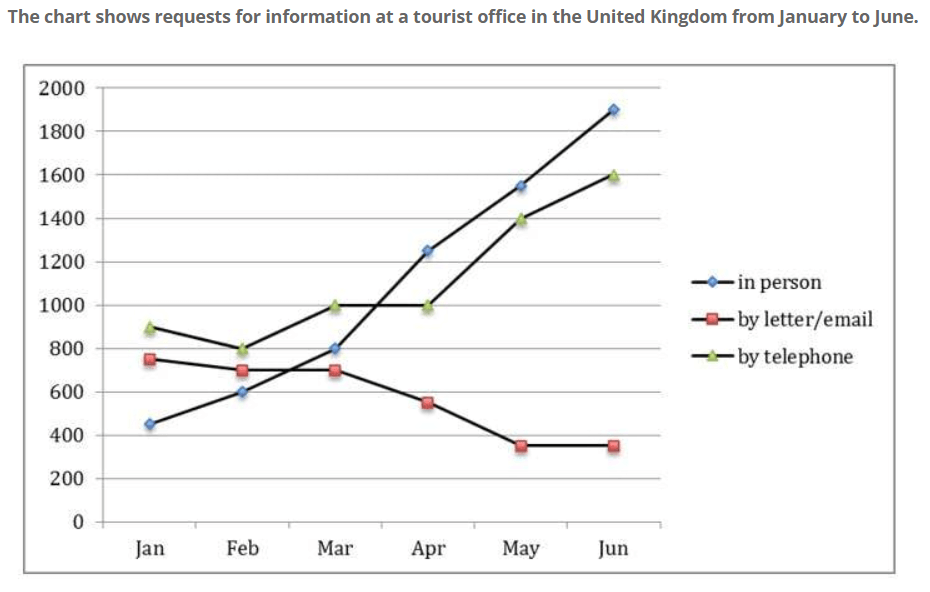
The line graph depicts the number of requests for information (in-person, by letter/email, and by telephone) at a UK tourist office between January and June.
Overall, in-person and telephone requests grew consistently, while letter and email requests declined slightly over the period given.
With regards to in-person requests, it began at around 410 requests in January and moved up steadily, reaching its highest point at about 1900 requests in June. Likewise, requests by telephone were below 1000 requests in January and fluctuated slightly before rising significantly from about 1000 requests in April to a peak of 1600 requests in the final months.
On the other hand, letter and email requests levelled off in the first three months (January, February, March) at around 700 requests. They, then, fell gradually from 700 requests to 390 requests from March till May before remaining stable at about 390 requests during the last 2 months.
by Zulharnai Kenesary
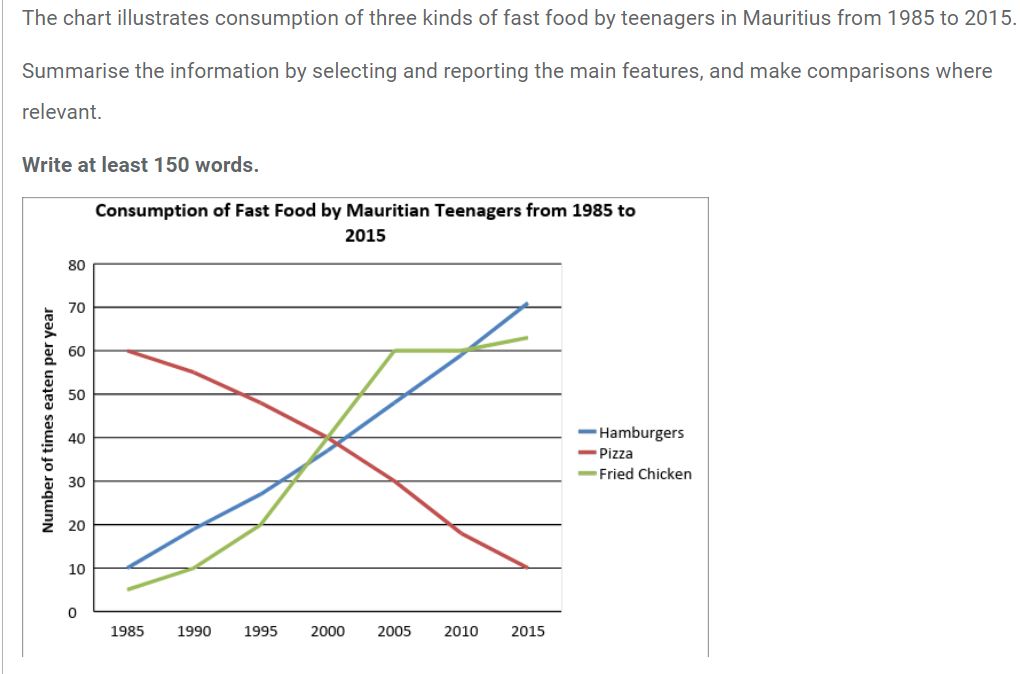
The line graph indicates the intake of three different types of fast food by Mauritian adolescents, measured in times eaten each year, between 1985 and 2015, in five-yearly intervals.
Overall, the fried chicken and hamburgers consumed by teenagers rose gradually, while pizza consumption declined steadily over the period given.
With regards to the consumption of pizza, it was the most popular among teenagers with nearly 60 times per year in 1985 before it decreased consistently to hit a low of around 10 times in 2015, becoming less popular than other two fast foods.
On the other hand, the consumption of hamburgers was about 10 times and it increased steadily, reaching its highest point at above 70 in 2015. Likewise, fried chicken intake began at approximately 5 times in 1985 after which the figure consistently moved up year on year until 2005. It, then, remained unchanged following 5 years, from 2005 to 2010, before growing slightly to a peak of around 62 times in 2015.
by Zulharnai Kenesary