
IELTS WT1 (Table)
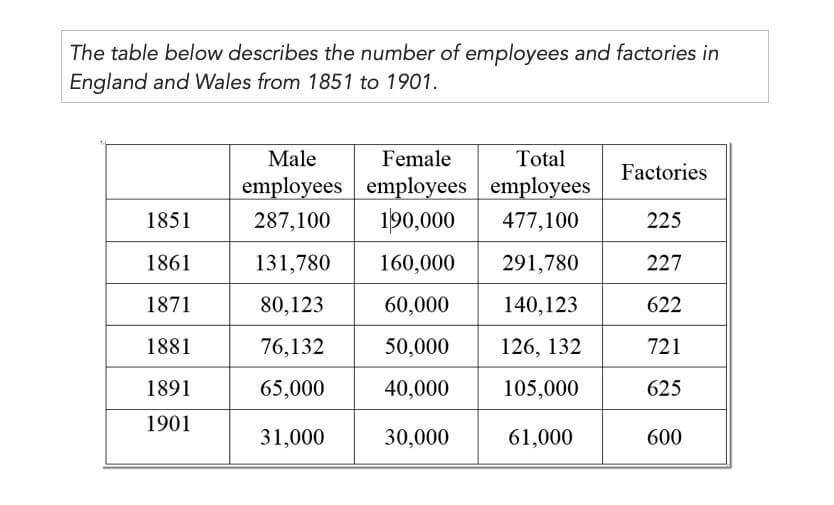
The given table provides information about the amount of labour and the number of factories in England and Wales between 1851 and 1901 with 10 years intervals.
Overall, total number of employees, including males and females, decreased dramatically. In contrast, there was a significant rise in factories’ number during the given 50 years.
In 1851, there were around 100,000 more men’s number in factories than women’s, showing exactly 287,100 people. Next 10 years their number dropped quickly by about 150,000. In the following periods, the sum of male employees continued decreasing gradually reaching the same number as female employees, approximately 30,000 people. The similarity of the trend in the amount of two genders’ labour was the rate of declining, demonstrating a fall around 10,000 people per a decade.
Interestingly, despite a decrease in 1891, the number of manufactures grew almost three-fold from 225 to 600 within the given 5 decades. It should be noted that when the sum of all employees went down sharply in first 30 years, there was a rapid jump by around 400 in the number of factories.
by Gulmira Kinzhekeyeva
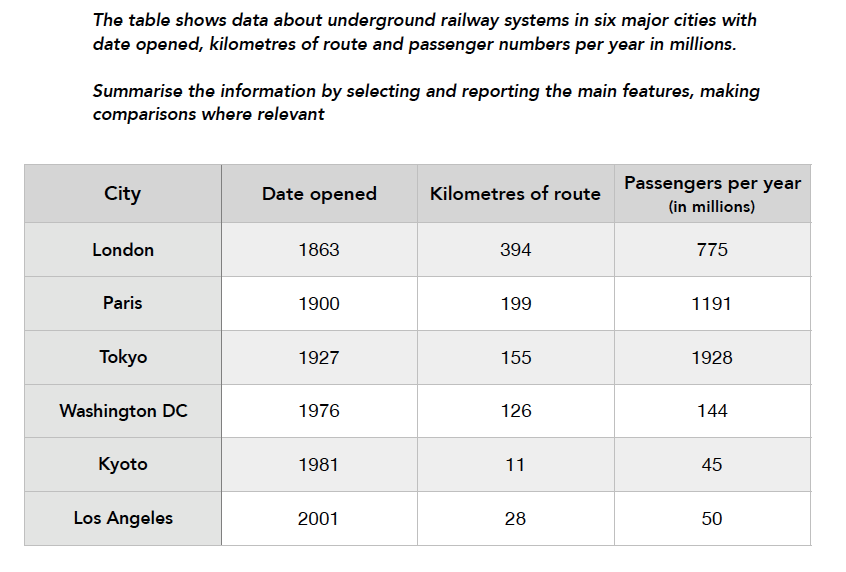
The given table provides information about underground railway networks with the first opened date, the distance of pathway and number of passengers in six large cities around the World per year.
Overall, the first built subway in London has the longest route, whereas the number of people who use it is at the third place by the provided table. In the capital of Japan, there are the highest number of passengers. In contrast, another city of Japan illustrates the smallest number of passengers per year, that is almost similar to Los Angeles, where the tube has been recently opened.
The UK’s capital has the oldest underground system, which was built in 1863. This system’s distance is about 400 km, displaying the longest way among other cities. However, the number of travellers takes third point with 775 million people. While the second opened subway in another European city, with almost twice shorter route, has far more passengers with over 1000 million people.
In Tokyo and Washington, subway networks’ lengths are similar, but Asian city has the highest number of travellers, moreover, the network was constructed about 50 years earlier than the second city’s system. Kyoto and Los Angeles have the shortest pathways with just over 10 km and under 30 km respectively, and have the fewest number of travellers as well, with 45 and 50 millions people accordingly.
by Gulmira Kinzhekeyeva
The table below shows expenditures of four car companies on advertising in the UK in 2002.
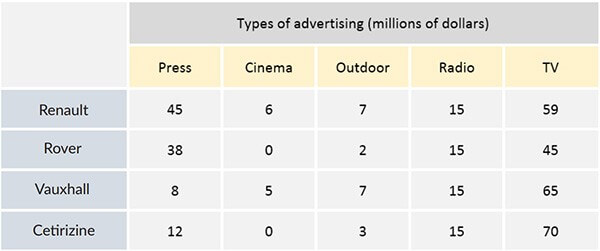
The table compares four different car companies, namely Renault, Rover, Vauxhall, and Cetirizine, in terms of the expenditures on five advertising types including press, cinema, outdoor, radio and television in 2002.
Overall, all four car companies spent highest money on TV advertising, while that of cinema was the lowest. Also, total spending of Renault for advertising was higher than the other companies.
The advertising spending on radio of four car companies was equal, with 15 million dollars. Those of cinema were much smaller, with only 6 million and 5 million of Renault and Vauxhall respectively; especially Rover and Cetirizine had no expenditures for this type. In terms of outdoor advertising, Renault and Vauxhall had equal expenditure, with 7 million, followed by Rover and Cetirizine, with only 2 million and 3 million respectively.
With regard to TV advertising, Cetirizine spent the highest amount of money with 70 million, compared to those of Renault, Rover and Vauxhall with 59 million, 45 million and 65 million accordingly. Finally, the expenses for advertising on press of four car companies were very unequal, with 45 million of Renault and only 8 million of Vauxhall.
by Bekassyl Adenov
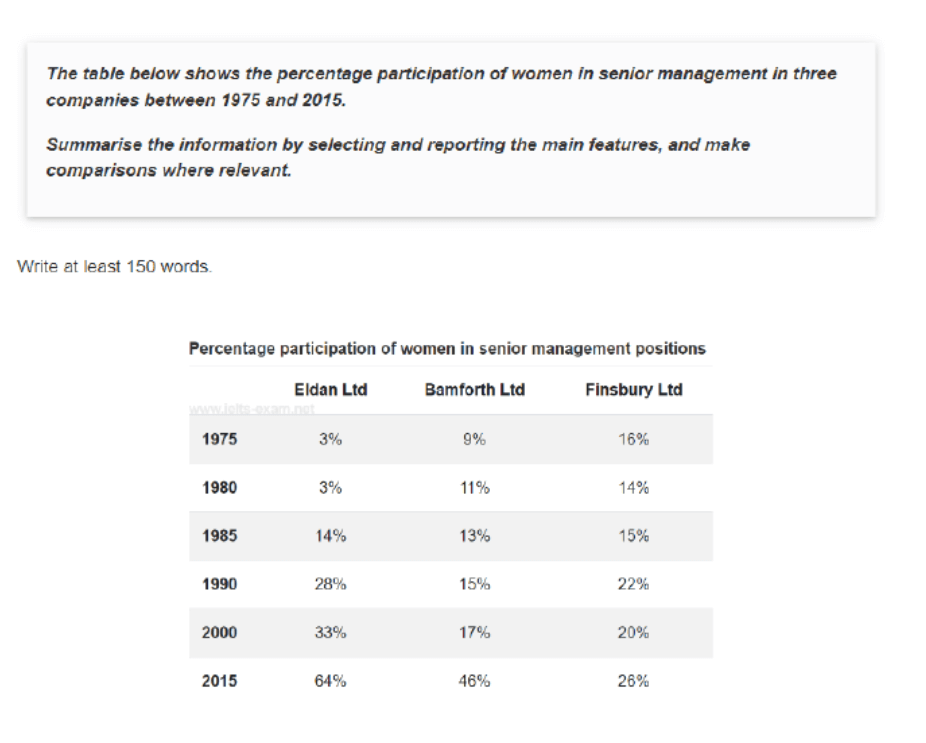
The table illustrates the proportion of women’s participation in senior management roles in three companies from 1975 to 2015.
Overall, in 1975 Finsbury Ltd had the biggest percentage of women in senior management roles, however it was later beaten by Eldan and Bamforth. The least proportion of women in senior management roles worked in Eldan Ltd in the beginning, but over the recorded time it changed significantly, resulting the highest rate.
In 1975, there was a highest number of female workers in management positions in Finsbury Ltd, accounting for 16 percent. This figure gradually increased to 26% by 2015, after a slight fall to 14 percent in 1980. Whereas Eldan Ltd had the least percentage of senior manager women in 1975, constituting 3 percent and remaining the same for five years. In 1980 it went on increasing significantly until it peaked at 64 percent in 2015.
Bamford ltd was the second popular company, who employed more women for senior management positions in 1975. There was a gradual increase in the percentage of female workers, which steadily rose for 2 percent every five years till 2000. Subsequently, over the following years employment rate for women in senior positions at Bamford company increased sharply for almost a third, reaching 46 percent by 2015. A similar trend in percentage of women in senior roles were noticed in 1985 among all the three companies, accounting for approximately 15% each.
by Adina
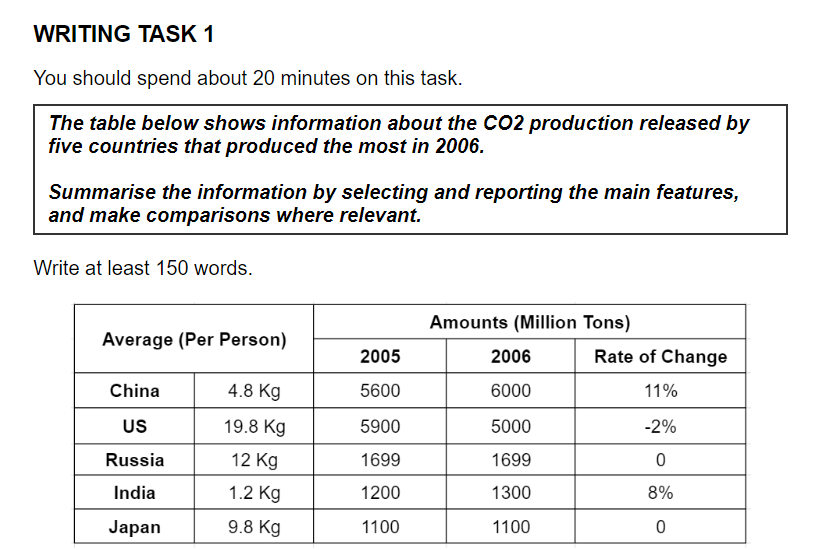
The table provides data on CO2 emissions from five countries — China, the US, Russia, India, and Japan — in 2005 and 2006, including the rate of change and per person emissions.
Overall, China and India showed significant increases in emissions, while the US recorded a slight decrease. Emissions in Russia and Japan remained stable during this period.
In 2005, the US had the highest CO2 emissions per person at 19.8 kg, with total emissions of 5900 million tons. However, in 2006, its total emissions decreased by 2%, reaching 5000 million tons. Meanwhile, China, with a per capita rate of 4.8kg, saw its total emissions increase by 11%, from 5600 million tons in 2005 to 6000 million tons in 2006.
Russia’s CO2 emissions remained unchanged at 1699 million tons over the two years, with a per capita rate of 12 kg. Similarly, Japan showed no change in emissions, remaining steady at 1100 million tons with a per capita emission of 9.8 kg. In contrast, India, having the lowest emissions per person at 1.2 kg, increased its total emissions from 1200 to 1300 million tons, an 8% rise.
by Abinur
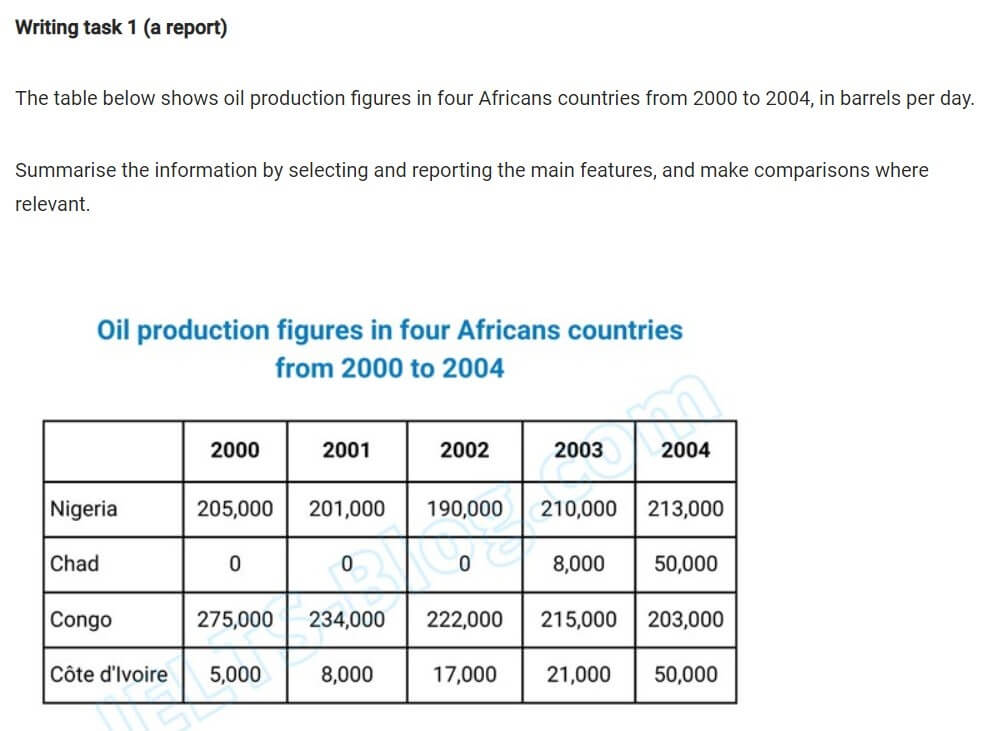
The table depicts the daily oil production quantities of four African countries.
Overall, Chad and Cote d’Ivoire experienced significant increases over the years, while Congo witnessed a steady decline.
Starting in 2000, Chad did not produce any oil, maintaining a production level of 0 for three consecutive years. However, in 2003, Chad began producing oil at 8,000 barrels, and this figure increased to 50,000 barrels by 2004. Although Congo initially had the highest oil production, at 275,000 barrels, this figure steadily declined, reaching just 203,000 barrels by 2004.
Nigeria ranked second in oil production in 2000, producing 205,000 barrels. Despite a drop to 190,000 barrels in 2002, its production reached 213,000 barrels by the end of the period. In contrast, Cote d'lvoire had a low production level of 5,000 barrels in 2000. By 2004, this amount grew tenfold, matching Chad’s production for that year.
by Adina (Astana)
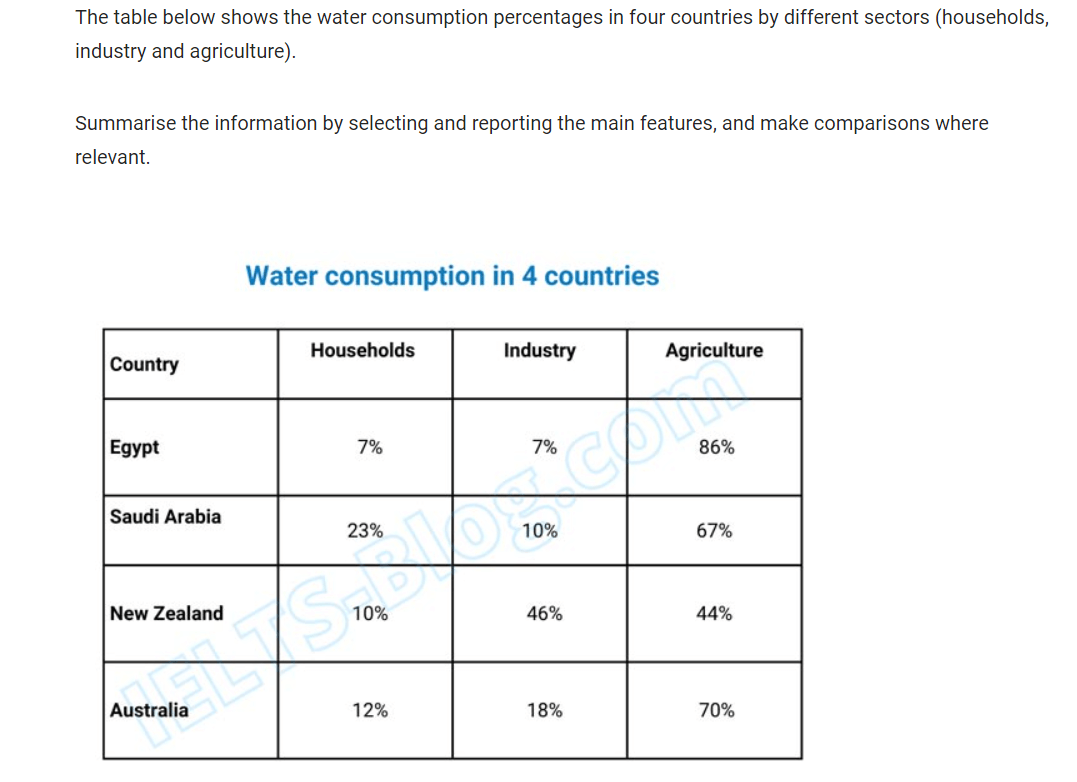
The table shows the percentage of water consumption in four countries (Egypt, Saudi Arabia, New Zealand, and Australia) divided by sectors: households, industry, and agriculture.
Overall, the highest percentage of water is used in agriculture while the lowest percentages are seen in households and industry areas in Egypt.
In Egypt, agriculture dominates water usage with 86%, while both households and industry account for only 7% each. Similarly, in Saudi Arabia, agriculture consumes 67% of the water, followed by households at 23% and industry at 10%.
In contrast, New Zealand uses almost half of its water (46%) for industry, making it the leading sector. Agriculture and households consume 44% and 10%, respectively. Australia shows a similar trend to Saudi Arabia, with 70% of water used for agriculture, 18% for industry, and 12% for households.
by Bojar