
IELTS WT1 (Multiple Graphs)
The charts below show the amount of rainfall and the average monthly maximum and minimum temperatures for two Australian cities in the year 2018.
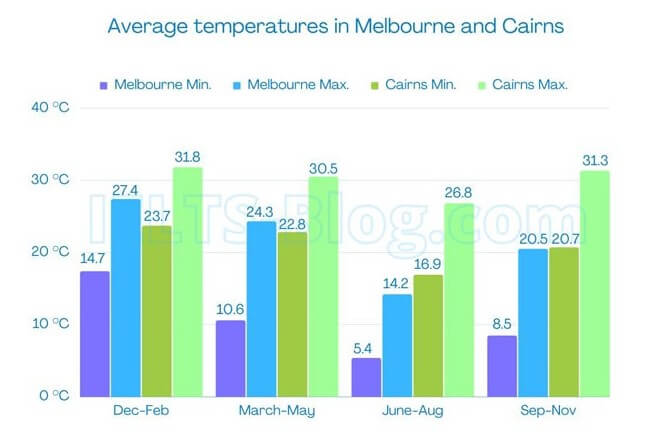
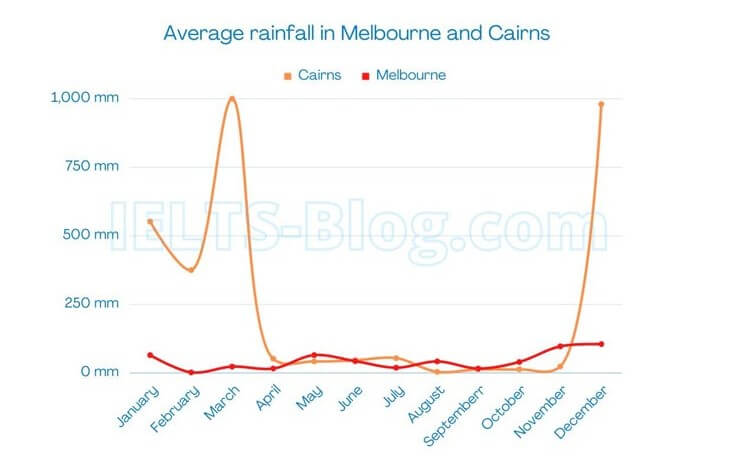
The two charts illustrate precipitation and the temperature range with the highest and lowest number for every month in Melbourne and Cairns in 2018.
Overall, during the period Melbourne had less amount of precipitation and temperature level than Cairns.
In January, average rainfall in Cairns was more than 500mm and fell to approximately 375mm next month, but then started to rise dramatically and reached a peak of 1000mm in March. The precipitation fell sharply from March to April and was about 50mm. For the next 7 months rainfall remained almost steady and in November the average amount skyrocketed and almost reached 1000mm. In comparison, Melbourne experienced small amount of rainfall about 60-80mm with some fluctuations during the span.
The temperature level in Cairns ranged from 16,9 to 31,8. The lowest temperature level had been seen from June to August and the highest one from December to February. In June, July and August there was the minimum temperature in Melbourne and the maximum was from December to February, which is 5,4 and 27,4 centigrade respectively. In September-November the lowest temperature in Cairns and the highest temperature in Melbourne were almost the same, which is 0,2 Centigrade difference.
by Daniya Bekentaeva
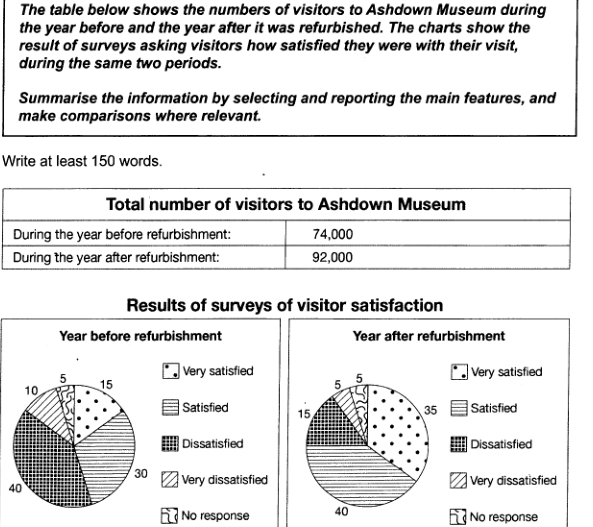
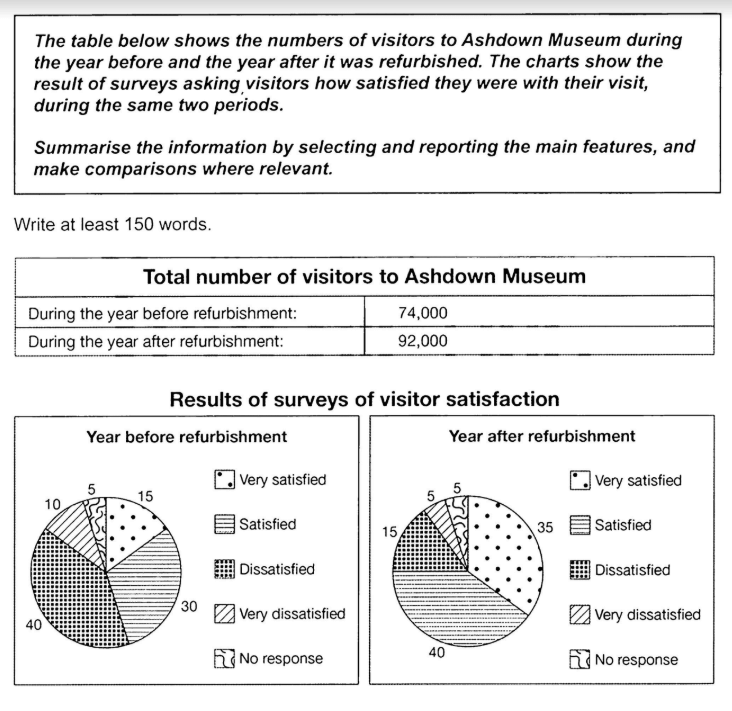
The supplied table depicts how many visitors Ashdown Museum had the year before and the year after it was refurbished. The illustrations delineate the results of survey about visitors’ satisfaction during these periods.
Overall, it is worth mentioning that the number of visitors after refurbishment increased tremendously, as well as the proportion of very satisfied people. Group of satisfied visitors was significant during the both periods of time, and the figure of dissatisfied people witnessed a dramatic drop.
It can be seen, Ashdown Museum was visited by 74 000 people before its refurbishment. The year after, the number of visitors went up by almost 20 000 people and made up 92 000. The majority of visitors were dissatisfied with the museum before refurbishment and accounted for 40% of all visitors. However, in the second given period of time, this proportion saw a huge fall to only 15%. After renovation the number of very satisfied people rocketed enormously from 15% to 35% of visitors.
Before refurbishment a lot of people were satisfied with the museum and constituted approximately a third of visitors. During the year after, the figure witnessed a noticeable rise and became a leading group with 40%. The proportion of very dissatisfied people dropped minimally to the same level as the number of people who did not respond — 5%.
by Zhanel Dorzhigulova
The bar chart and table below describe the proportions of part-time and full-time workers in 2011 in Australia.
Summarise the information by selecting and reporting the main features, and make comparisons where relevant.
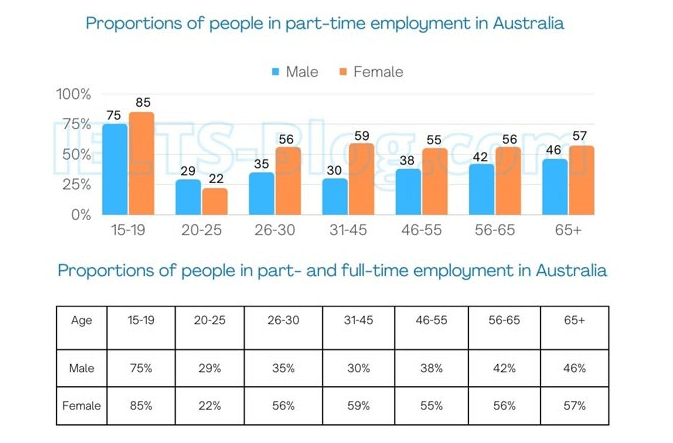
The bar chart and table show the percentage of people who worked part and full time in the year of 2011 in Australia.
Overall, the proportion of women who worked part-time was more than men over the period.
In 2011, 85 per cent of female had a part-time job at the age of 15 to 19 , whereas the proportion of young women (20-25) accounted for only 22%. Both 26-30 years old and 56-65 years old groups women had the same percentage, which is 56%. Similarly, 46-55 age female adults had 55 per cent. Females at the age of 31-45 and 65+ had a part-time job with 59 and 57 % respectively.
Similar to women, male teenage group had the highest percentage among all the age, which is 75%. At the age of 20-25, 29% of male worked part-time. Men at the age from 26 to 55 had a part-time work in the range of 30-38 per cent. The percentage of 56-65 adults and the elderly men was 42% and 46 % accordingly.
by Daniya Bekentaeva
The table illustrates the total of visitors to Ashdown Museum in the year before and after the renovation. The pie chart shows the change in customer satisfaction over these two years.
Overall, after refurbishment, the number of visitors grew and significantly more people enjoyed their visit to the museum.
In the year before reconstruction Ashdown museum welcomed 74 000 of guests. This place made a poor showing for half of them, in particular, 40% of respondents left dissatisfied and 10% found their visit extremely disappointing. Only 15% found their visit remarkably enjoyable and 30% were satisfied.
After the renovation, the flow of visitors increased to 92 000. The level of visitor satisfaction improved dramatically: three-quarters of individuals surveyed were happy with the upgraded museum. However, 15 of visitors had a mostly negative experience, and the small minority (5%) reported being very dissatisfied. The per cent of people who decided not to share their impressions remained the same (5%).
by Alesia Leschinskaya
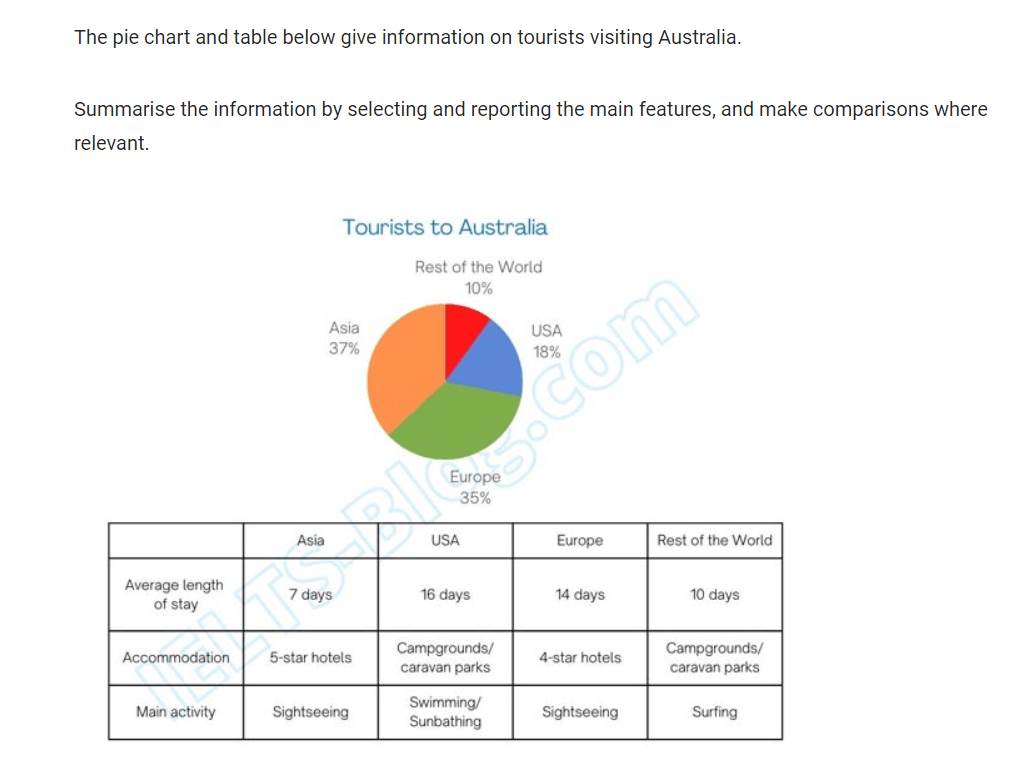
The pie chart and table illustrate the distribution of tourists visiting Australia, their regions of origin, average length of stay, accommodation preferences, and main activities. The data highlights distinct preferences and habits among tourists from different parts of the world.
Overall, Asian tourists make up the largest share of visitors to Australia, accounting for 37%, followed closely by European tourists at 35%. American visitors represent 18%, while the remaining 10% come from other parts of the world.
This distribution shows that the majority of tourists originate from Asia and Europe, likely due to their proximity and strong cultural or economic ties to Australia.
The length of stay varies significantly across regions. Tourists from the USA spend the most time in Australia, with an average of 16 days, followed by Europeans at 14 days. In contrast, Asian visitors stay for just 7 days, possibly due to shorter travel distances and more compact itineraries. Visitors from the rest of the world stay for an average of 10 days, indicating a balanced duration compared to other groups.
by Ainel